

With this post, we’re beginning a series of articles about features and details of the MultiCAD.NET API for creating and modifying table entities.
For many drawings, tables are indispensable: they’re used to present descriptions, specifications, and instructions for creating construction elements represented in a drawing. It’s common to create tables based on properties extracted from drawing objects. Automating this process can save time and reduce errors.
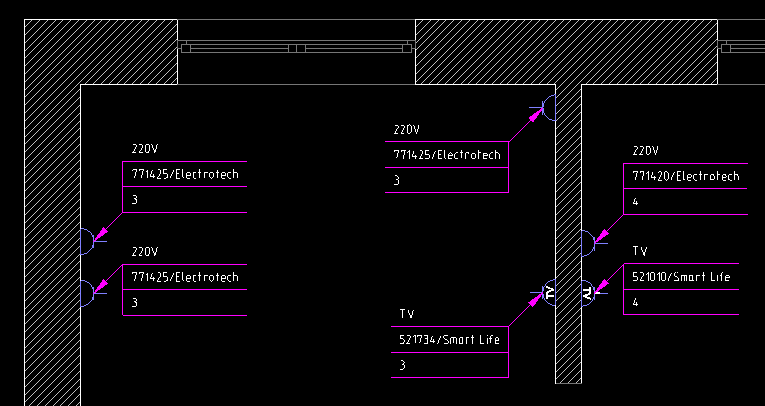
As an example, let’s consider generating a report that contains a list of socket properties extracted from an electric map (a drawing that illustrates socket placement for a number of rooms.) Each socket is marked by a note that contains the following text data:
- socket type,
- code number/manufacturer,
- room number.
The algorithm to create the table can be divided into three steps:
- creating the custom report template,
- loading the template and filling the table with data,
- breaking the entire table into a number of pages and inserting the pages.
Creating the table template
Usually table reports are based on standard templates that are created with the tables UI. For demonstration purposes we are going to create a custom template using the MultiCAD.NET API, so that the whole table will look as follows:
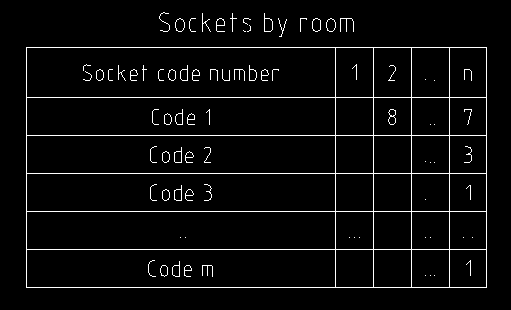
Each cell value represents the number of sockets of a specific code in a specific room. Also, the table contains a page header that could be added for each page and a header for the first page with the table’s title.
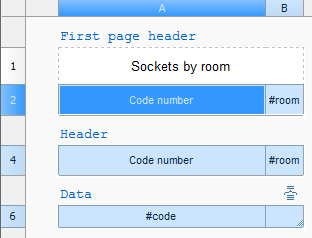
Here is an example of the method that creates the template and saves it to a file with a specified name:
|
1 2 3 4 5 6 7 8 9 10 11 12 13 14 15 16 17 18 19 20 21 22 23 24 25 26 27 28 29 30 31 32 33 34 35 36 37 38 39 40 41 42 43 44 45 46 47 48 49 50 51 52 |
bool CreateTemplate(string FileName) { McTable table = new McTable(); table.DefaultCell.HorizontalTextAlign = HorizTextAlign.Center; table.DefaultCell.VerticalTextAlign = VertTextAlign.Center; table.Columns.AddRange(0, 2); table.Columns[0].Width = 55; table.Columns[1].Width = 10; // Adds a section for the first page header table.Rows.InsertSection(SectionTypeEnum.HeaderFirst, 0, 2); System.Drawing.Rectangle rect = new System.Drawing.Rectangle(0, 0, 1, 0); table.Merge(rect); table[0, 0].TextHeight = 3.5; table.Rows[0].Height = 10; table[0, 0].Value = "Sockets by room"; foreach (var cell in table.Rows[0].Cells) cell.SetBorderLineweight(BorderTypesEnum.ButBottom, -9); table.Rows[1].Height = 8; foreach (var cell in table.Rows[1].Cells) { cell.TextHeight = 2.5; } table[1, 0].Value = "Code number"; table[1, 1].Value = "#room"; // Adds a section for the any page header table.Rows.InsertSection(SectionTypeEnum.Header, 2); table.Rows[3].Height = 8; foreach (var cell in table.Rows[3].Cells) { cell.TextHeight = 2.5; } table[3, 0].Value = "Code number"; table[3, 1].Value = "#room"; // Adds a data section table.Rows.InsertSection(SectionTypeEnum.None, 4); table.Rows[5].Height = 6; table[5, 0].Value = "#code"; // Saves the table to a file if (!table.SaveToFile(FileName)) { return false; } return true; } |
Users will be able to change the suggested table’s structure and cell formatting in the table editor.
This implementation of the table contains cells with special string identificators: #code and #room. These strings help to find the correct place for the data when the table is being filled. This ensures the table will be filled properly even if the numbers of rows or columns are changed.
Constructing a report
An algorithm for report building can be divided into the following steps:
- adding the command for creating the report
- selecting all the notes for multilayered constructions that contain description for sockets,
- loading the template and open the table editor to provide the ability to make changes in the template manually,
- structuring the data from the selected objects,
- filling in the table headers (the table’s title and column names),
- filling in the rows.
Here is the entire code for the example, with a discussion of key points:
Adding the command for creating the report
We will add the key method that is the handler for the smpl_CreateTableReport command and implements the algorithm:
|
1 2 3 4 5 6 7 |
[CommandMethod("smpl_CreateTableReport", CommandFlags.NoCheck | CommandFlags.NoPrefix)] public void smpl_CreateTableReport() { // Code } |
Selecting objects
Selecting all notes for multilayered constructions can be performed using object filter:
|
1 2 3 4 5 6 7 |
McObjectId[] idSelecteds = ObjectFilter.Create(true).AddType(McNoteMultilayer.TypeID).GetObjects().ToArray(); if (idSelecteds == null || idSelecteds.Length == 0) { return; } |
As a result we will get an array of Ids for all notes in the drawing. Using these Ids we can obtain a text string of each note:
|
1 2 3 |
McNoteUnitCollection units=(McNoteMultilayer)id.GetObject()).Units; |
To simplify filling up the table, all text data should be arranged in an single structure that supports searching and sorting operations. Here the following structure of nested dictionaries is used: <product_code<room_number, count=”">>.
Loading the template
Let’s assume that the template is already created and saved to an external file (for example, C:\template.dat file) using the CreateTemplate() method. Now the saved table can be loaded using the McTable.LoadFromFile() method. Let’s create a table object, read the saved table into it and launch the table editor. It’s important to note that the table must be saved in a format that can keep the table’s structure and formatting, as well as its contents.
|
1 2 3 4 5 6 7 8 9 |
const string FileName = "C:\\template.dat"; McTable Table = new McTable(); if (!Table.LoadFromFile(FileName)) { return; } Table.OnEdit(); |
After that we can switch to filling up the table. The process includes sorting data received from the notes strings and adding them in appropriate cells. There is a quite wide list of possible implementations, one of which you can find in the example’s source code.
Page division
MultiCAD.NET contains an effective ability to divide a table into multiple fragments without losing its integrity. It’s used to split a large table in order to place it on a smaller sheet of paper, while still being able to edit it as a whole. To insert a page breaks by maximum page height the McTable.PagesTable.SetPageHeight() is used.
The following code fragment divides the table into separable pages so that the total height of the filled rows of each page should be less than 50 mm:
|
1 2 3 4 5 6 7 8 |
const double pageHeight = 50; double tableHeight = Table.DbEntity.BoundingBox.SizeByY; if (tableHeight > pageHeight) { Table.Pages.SetPageHeight(pageHeight); } |
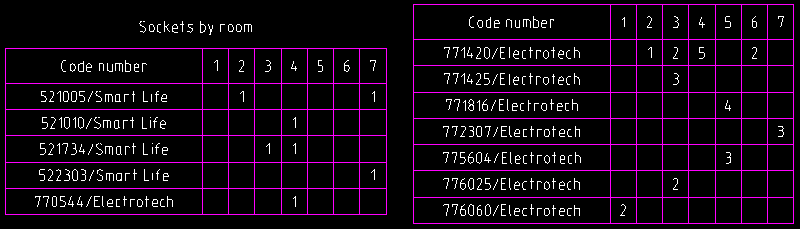
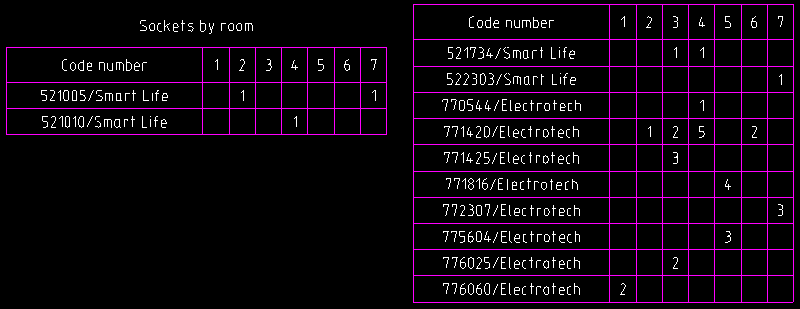
Another option is to insert a page break by a row index using the McTable.PagesTable.SetPageBreak() method. For example, to insert a page break after the row with index 7:
|
1 2 3 |
Table.Pages.SetPageBreak(7); |
The result table will contain two pages:
After the table is divided, insertion points for each page need to be set. The points are set relative to the table’s insertion point using the McTable.PagesTable.SetOriginPage() method. The first parameter of the method is a page index, and the second parameter is the page insertion point. For example, to insert pages with the interval of 5:
|
1 2 3 4 5 6 |
for (int n = 0; n < Table.Pages.Count; n++) { Table.Pages.SetOriginPage(n, new Point3d(n * (tableWidth + 5 * Table.DbEntity.Scale), 0, 0)); } |
Loading the example application to AutoCAD
Like any MultiCAD application, the example can simply run in nanoCAD after loading the example’s assembly and calling the registered smpl_CreateTableReport command. To run the MultiCAD application in AutoCAD, it’s required to use the special Object Enabler application. It’s important to note that the standard MultiCAD Enabler for AutoCAD (which is available in the nanoCAD Developers’ Club) doesn’t support objects from the Multicad.Symbols namespace. For running applications that deal with such objects, SPDS GraphiCS or MechaniCS (that contain full set of primitives including table and note entities) should be launched first.
Pingback: Tables in MultiCAD.NET. Part 2: Creating and modifying | nanoCAD API Blog